
We also know TRIN as the Arms Index. This is a market breadth indicator used to measure the strength or weakness of the stock market. The Arms Index was developed by Richard W. Arms Jr. in 1967 and is widely used by traders to analyse market sentiment. Traders also call it TRIN or the Trader’s Index. The indicator combines advance-decline data along with trading volume to understand whether buying pressure or selling pressure is dominating the market. In this page, we will check the TRIN chart of the Nifty index, analyse this breadth indicator on the NSE market and more.
TRIN is particularly useful when we want to identify short-term overbought or oversold conditions in the market. Because of this ability, many traders use TRIN to anticipate possible market reversals.
We can easily apply this indicator to indices like the NIFTY 50 to analyse the overall market sentiment.
On this page, we plot the 10-day Simple Moving Average (SMA) of the Nifty TRIN along with the Nifty index in the same chart. This helps smooth out the daily fluctuations and makes the signals easier to interpret.
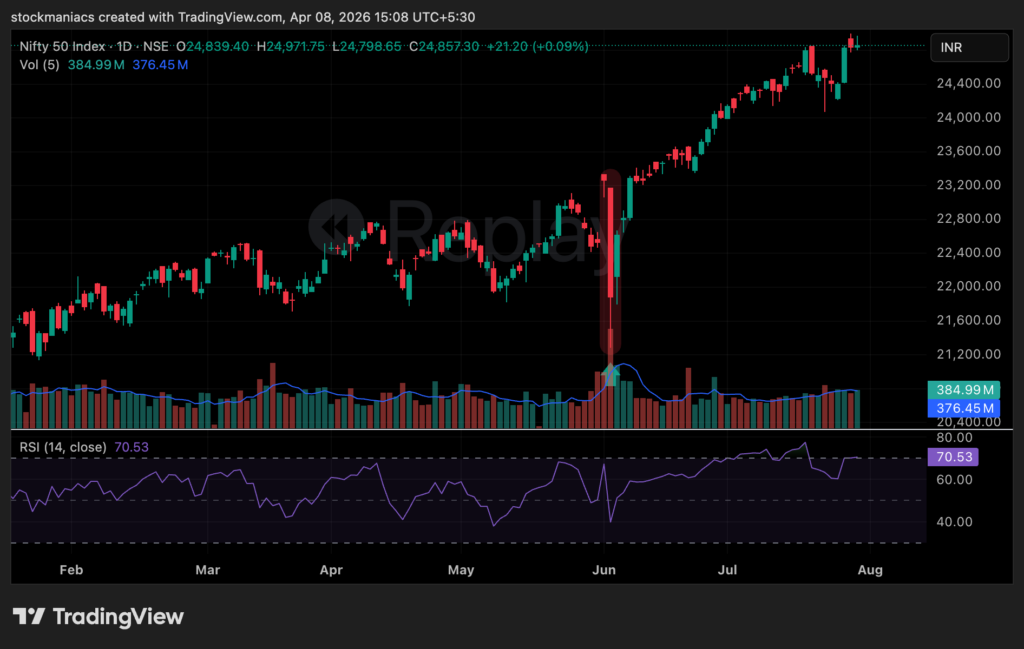
Nifty TRIN Chart With 10-Day SMA
This widget plots the TRIN indicator and its 10-day SMA together with the Nifty index. It helps traders visually understand how market breadth interacts with index movements.
The chart shows:
• Nifty index price
• Daily TRIN values
• 10-day SMA of TRIN
The chart is updated at the end of each trading day.
Today’s Nifty TRIN Signal
This widget displays the latest TRIN reading and the market signal derived from it.
This widget helps traders quickly understand the current market breadth condition without reading the entire chart.
What Is TRIN (Arms Index)?
The TRIN indicator, also known as the Arms Index, is a market breadth indicator that measures the relationship between advancing and declining stocks along with their respective trading volumes.
Unlike many technical indicators that focus on price alone, TRIN measures market participation and internal strength. This makes it very useful for understanding whether a market rally or decline is supported by broad participation.
In simple words, TRIN tells us whether buyers or sellers are dominating the market activity.
When buyers dominate the market, TRIN tends to move below 1.
When sellers dominate the market, TRIN generally moves above 1.
Because of this behaviour, traders use TRIN to detect potential turning points in the market.
How To Calculate TRIN?
You can calculate TRIN easily using the advance-decline data and their respective volumes.
The calculation of TRIN involves three steps.
Step 1 – Advance Decline Ratio
Advance Decline Ratio = Advances / Declines
Advances represent the number of stocks closing higher during the trading session, while declines represent the number of stocks closing lower.
Step 2 – Advance Decline Volume Ratio
AD Volume Ratio = Up Volume / Down Volume
Up volume is the total trading volume of advancing stocks, while down volume represents the volume of declining stocks.
Step 3 – TRIN Formula
TRIN (Arms Index) = Advance Decline Ratio / AD Volume Ratio
This formula measures whether volume confirms the market direction.
How To Interpret TRIN?
This widget shows the meaning of different TRIN levels.
When the AD Volume Ratio is greater than the AD Ratio, TRIN moves below 1 and indicates market strength.
When the AD Ratio is greater than the AD Volume Ratio, TRIN moves above 1 and indicates market weakness.
Therefore, TRIN helps traders identify situations where the market may be temporarily overbought or oversold.


Example: TRIN Panic Signal And Nifty Reversal
On 4 June 2024, the TRIN indicator surged to 3.05, signalling extreme panic selling in the market. Such high TRIN values often indicate that the market is approaching short-term oversold conditions. After this spike, the Nifty 50 index rebounded strongly, confirming how TRIN can help traders identify potential reversal points during periods of heavy selling pressure.
TRIN Interpretation On A Single-Day Basis
On a single-day basis, the TRIN values can be interpreted as follows:
- A value of 1 is considered neutral.
- A value less than 1 indicates an overbought market condition.
- A value greater than 1 indicates an oversold market condition.
These levels help traders quickly assess the short-term sentiment of the market.
TRIN Interpretation On A 5-Day Basis
When TRIN is averaged over five days, the signals become smoother.
- A value of 5 is neutral.
- A value below 4.5 indicates overbought conditions.
- A value above 6 indicates oversold conditions.
Using averages helps eliminate daily noise in the data.
TRIN Interpretation On A 10-Day Basis
The 10-day TRIN is widely used by analysts because it smooths the indicator further.
- A value of 10 is neutral.
- A value less than 9 indicates overbought conditions.
- A value greater than 12 indicates oversold conditions.
Because of its reliability, many traders monitor the 10-day TRIN values to detect potential market reversals.
How To Use 10-Day SMA With Nifty TRIN Chart?
To make TRIN signals easier to understand, traders often use the 10-day Simple Moving Average of TRIN.
Using the SMA helps smooth out the daily fluctuations and allows traders to focus on the broader market sentiment.
Here is how traders interpret the 10-day SMA of TRIN.
- We use the 10-day SMA of TRIN along with TRIN to smooth the data.
- When the 10-day SMA of TRIN rises above 3, the market may be oversold, and a bounce may occur.
- When the 10-day SMA of TRIN drops below 0.5, the market may be overbought, and a correction may follow.
These signals are particularly useful for short-term traders looking for market reversals.
Historical Nifty TRIN Data
This widget displays recent historical TRIN data along with the Nifty index values. Traders can analyse how the index behaved when TRIN reached extreme levels.
TRIN Market Extremes
This widget highlights historical extremes of the TRIN indicator.
It helps traders answer questions like:
- When did the market experience extreme panic selling?
- When did the market become extremely overbought?
- How did the Nifty react after those signals?
Such analysis helps traders understand the predictive behaviour of market breadth indicators.
Why Traders Use The TRIN Indicator?
TRIN is popular among traders for several reasons.
First, it measures market breadth, which provides insight into the overall participation in a market move.
Second, it combines price direction with trading volume, making it more reliable than indicators based only on price.
Third, TRIN often signals short-term market extremes, which helps traders identify potential reversal points.
Because of these advantages, many professional traders monitor TRIN along with other breadth indicators like advance-decline ratios and volume indicators.
Final Thoughts
The Nifty TRIN Chart with 10-day SMA is a useful tool for understanding the internal strength of the stock market.
By combining advance-decline data with trading volume, TRIN helps traders determine whether buying or selling pressure is dominating the market.
Although TRIN should not be used as a standalone trading signal, it becomes extremely powerful when combined with:
• price action
• support and resistance levels
• other market breadth indicators
Monitoring TRIN regularly can help traders identify overbought and oversold market conditions, anticipate short-term reversals, and gain a better understanding of overall market sentiment.
The Nifty TRIN chart on this page is updated at the end of each trading day, helping traders stay informed about the latest market breadth conditions.
Next, Check Out Other Market Charts
- Click Here to track live Gift Nifty movement and global market sentiment before the Indian market opening.
- Click Here to analyse end-of-day technical trends and price action of Nifty 50 stocks.
- Click Here to monitor EOD movement and technical strength of Nifty Next 50 companies.
- Click Here to follow end-of-day trends and momentum in leading midcap stocks.
- Click Here to evaluate market valuation using the historical PE ratio indicator.
- Click Here to study Point & Figure trend analysis for index movements.
- Click Here to track real-time market breadth using advancing versus declining stocks.