
Just input today’s open, high, low and close values in the Camarilla Calculator below to get tomorrow’s support and resistance as well as breakout and breakdown levels. Mobile users need to scroll horizontally to see the full Camarilla pivot points below.
Understanding the Three Camarilla Calculator Modes
This Camarilla Pivot Point Calculator includes three powerful calculation modes designed for different trading styles. Each mode uses the same core Camarilla equations but presents the levels in ways that help traders identify reversals, breakouts, and extreme price targets.
1. Classic Camarilla Pivot Levels
The Classic Camarilla mode calculates the traditional R1–R4 resistance levels and S1–S4 support levels using the standard Camarilla formula. These levels are widely used by intraday traders to identify potential reversal zones around the previous close. Traders typically watch R3 and S3 for mean-reversion trades while R4 and S4 often act as strong breakout levels.
2. Camarilla Breakout Trading System
The Camarilla Breakout mode converts the standard levels into a practical trading framework. It highlights breakout and breakdown zones based on the well-known SureFireThing Camarilla strategy. In this mode, traders monitor R4 for bullish breakouts and S4 for bearish breakdowns, while R5 and S5 act as potential breakout targets. This setup is popular among momentum traders who focus on strong market moves.
3. Advanced Camarilla Extreme Targets
The Advanced Camarilla mode adds extended levels such as R6 and S6, which represent extreme price targets during highly volatile sessions. These advanced projections are useful when markets trend strongly beyond the normal Camarilla range. Traders often use these levels to estimate maximum intraday expansion zones or profit targets during trending markets.
Using these three modes together helps traders analyse both reversal opportunities and breakout momentum, making the Camarilla calculator a versatile tool for intraday trading strategies.
How to Use the Camarilla Calculator?
The main way to use the Camarilla equation in stocks or indices is to wait for the price to approach S3 or R3. When the price does so, traders expect the market to reverse at S3 and R3 levels, and so they open positions against a trend and place protective stop losses outside the closest S4 or R4 level.
The stop level at S4/R4 is only a suggested stop; you’ll learn why below. Traders are encouraged to find their own stops according to the money management rules and risk appetite.
Should one immediately place an order once the price hits the S3/R3 level? Yes, if you trade aggressively. No, if you like to see confirmation first. For confirmation, the price has to hit the S3/R3 level, find support or resistance there and clearly demonstrate an intention to reverse. Traders may want to learn about reversal candlestick formation patterns in order to be able to spot confirmation of a turning market.
The second way to trade stocks, indices, and forex with the Camarilla Equation is to look at S4/R4 levels to be breached, which would signal a breakout trade setup and allow traders to trade breakouts in the direction of a trend. For example, if the price pushes up through the higher S4/R4 level, the chances are it is going to keep on running that way. Breakout trading outside the S4/R4 level is expected to capture sharp directional market moves.
While running with the breakout outside S4/R4, use either the suggested S5/R5 level or your own target.
After setting Camarilla levels on the charts, traders look at where the market has opened regarding the levels.
Market Open INSIDE S3/R3 or Camarilla Pivot Points:
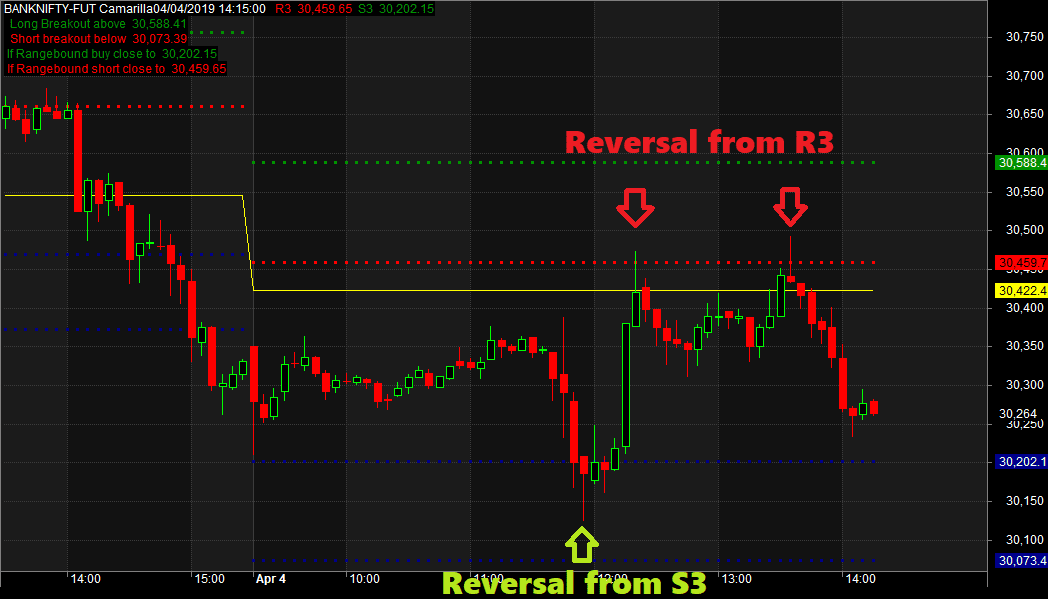
If the market opens inside the S3/R3 levels, you must wait for the price to approach either of these two levels. Whichever it hits first determines a trade: if the higher R3 is hit, Short against the trend in the expectation that the market is going to reverse. Initial SL above R4.
The opposite applies when the Lower S3 level is hit first – go long against the trend. Set SL below S4.


On the 4th of April 2019, Bank Nifty’s Future opened between S3 and R3. It has taken support at S3 and rallied up to R3. It has once again taken a reversal from the R3 level and come back to S3. Aggressive traders must look for a reversal candle before going long or short using the Camarilla Calculator.
Market Open OUTSIDE S3/R3 of Camarilla Pivot Points:
Taking profits is a matter of personal judgment – just be aware that you will want to take profits at some time during the day because the market is unlikely to “behave” and stay right-sided for your trade. These reversals from S3/R3 appear to happen as often as 4 times out of 5 during intra-day trading.
On 22nd February 2019, Bank Nifty Future opened outside of S3 and R3. As a result, it has broken down below S4 and made a downside rally throughout the day.
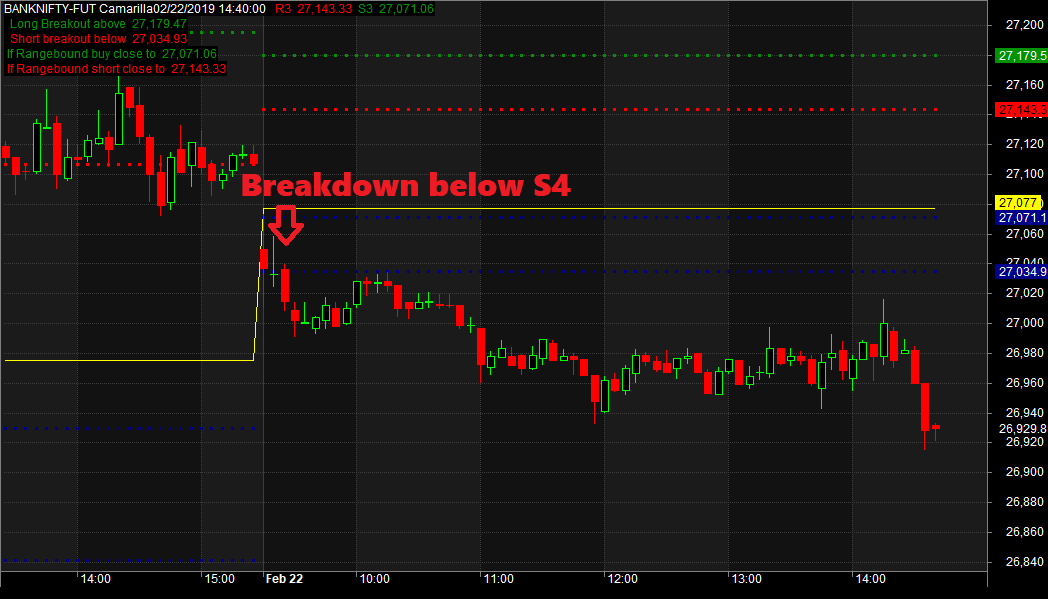
The best way to trade the breakouts is not to take the first breakout. For a buy trade, watch the stock crossing the R4 level. Then, if it retraces back to R4 or the R3 zone, take a long trade. Similarly, for a short-sell trade, do not take the first short-sell. Rather watch the stock breaking below the S4 level. Then enter a pullback. This will provide a low-risk, high-profit entry.
The Rules of Trade Entry Using Camarilla Pivot Points
How to Trade ‘UP’?
- The rule is when a bearish (white) candle hits support and closes on the support, the next candle should be BULLISH (clear candle), so you trade for the market to go UP immediately after that close of that candle.
- Be careful to note the following
- The candle MUST close on the support level OR
- It must have touched the support level at some time and closed as a BEARISH candle
- However, if it passes through and closes beyond the support level, it’s a NO TRADE.
How to Trade ‘DOWN’?
- The rules are exactly the opposite for a DOWN trade.
- When a BULLISH (white) candle hits resistance and closes on the resistance level, the next candle should be BEARISH (white candle), so you trade for the market to go DOWN immediately after that close of that candle.
- The candle MUST close on the resistance level OR
- It must have touched the resistance level at some time and closed as a BULLISH candle
- However, if it passes through and closes beyond the resistance level, it’s a NO TRADE.
Camarilla Calculator Combined with Pivot Points:
Sometimes you may have also noticed that Pivot supports and resistances and the beauty of price reversal at it. You may use both Camarilla levels and Pivot levels to achieve better trading results.
Using the Camarilla Calculator for Swing Trading
Do you know that apart from intraday trading, in delivery trading too this tool can be used? We are just calculating the next trading day’s levels using the calculator. We can input this week’s open, high, low and close data to get next week’s trading levels.
This can be used on every Friday or the last day of the week. Just input this week’s data in the calculator, and you will get next week’s PP and S1 to S4 and R1 to R4. Traders can use these levels for swing or delivery trading. You will get a weekly buy level and a short sell level. You will also get a weekly breakout buy level and breakdown short sell level.
Camarilla Pivot Points Strategy PDF
Download chapter 7 of the ebook Secrets Of A Pivot Boss by Frank Ochoa. This chapter is all about the Camarilla Pivot Points as traded by this master trader. Therefore, download the PDF and follow the techniques of the master.
Camarilla Calculator FAQ
This formula was introduced in 1989 by a UK bond trader named Nick Stott. The Camarilla Equation in calculates ten levels of intra-day support and resistance according to yesterday’s High, Low, Open and Close. There are 5 of these “S” levels below yesterday’s close and 5 “R” levels above. They has numbers S1, S2, S3, S4, and S5, etc. The most important levels are S3, R3, levels and S4, and R4. Camarilla Calculator is a technical tool that calculates these levels automatically from the last trading session’s open, high, low and close values. Just input these levels in the calculator, and it will calculate the trading levels automatically.
The formula used in the Camarilla equation is as follows:
Resistance 4 or R4 = (H-L)X1.1/2+C
Resistance 3 or R3 = (H-L)X1.1/4+C
The Resistance 2 or R2 = (H-L)X1.1/6+C
Resistance 1 or R1 = (H-L)X1.1/12+C
PIVOT POINT = (H+L+C)/3
Support 1 or S1 = C-(H-L)X1.1/12
Support 2 or S2 = C-(H-L)X1.1/6
The Support 3 or S3 = C-(H-L)X1.1/4
Support 4 or S4 = C-(H-L)X1.1/2
Here, O, H, L, and C represent the open, high, low and close values of the previous trading day.
Camarilla Pivot Levels differ from traditional pivot points because they focus more on mean reversion and breakout trading zones rather than simple support and resistance. The Camarilla equation generates multiple levels (R1–R4 and S1–S4) based on the previous day’s price range and close. Traders commonly watch R3 and S3 for reversal trades, while R4 and S4 indicate strong breakout or breakdown levels.
Conclusion
This article has explored how a camarilla calculator can help traders identify trading opportunities in the stock market. It has discussed the importance of day trading and provided readers with an understanding of this powerful tool from its development to its current use today. By using the Camarilla Calculator, traders are able to improve their chances of making successful investments so they can achieve lasting financial success. In conclusion, more information on the pivot point or Camarilla trading system or other pivot point strategies has been posted in our trading strategy section.
Check Our Other Trading & Investment Tools
- Gann Square of 9 Calculator – Forecast support, resistance, and price targets using the famous Gann methodology.
- Nifty Trend Finder Calculator – Identify the current Nifty market trend using technical indicators and price action.
- Pivot Point Calculator – Calculate pivot levels, support, and resistance for intraday trading.
- Elliott Wave Calculator – Analyse wave structures and potential market movement patterns.
- Fibonacci Calculator – Find Fibonacci retracement and extension levels for technical analysis.
- Volatility Calculator – Measure market volatility and assess trading risk effectively.
- Mutual Fund Return Calculator – Estimate SIP and lump sum mutual fund investment returns easily.
- LIC Maturity Calculator – Calculate the estimated maturity value for LIC insurance policies.
- LIC Surrender Value Calculator – Estimate the surrender value of your LIC policy quickly.